Most Important SEO Metrics to Consider in 2018

Another year means a fresh examination of your SEO strategy. What worked last year might not work this year… The original article is from SEMrush blog. The author, Guy Sheetrit is the Founder and CEO of Over The Top SEO. He holds broad expertise in the areas of SEO, Social Media, Digital Marketing, B2B, B2C Brand Development and online lead generation. Featured image courtesy of Felmeeeh via Bigstockphoto.
Search engine optimization and reporting go hand in hand. Clients need proper reports which help them understand the ROI achieved from SEO. In the past, a metric like keyword rankings was enough to make a client happy, but things have changed, and most importantly they have changed for the better.
So, what are the most important metrics that every SEO must consider in 2018? In my opinion, the ones listed below are of the highest priority:
Total Organic Clicks
In the Search Console, navigate to Search Traffic -> Search Analytics, and you will see a report that will give you a clear idea on the number of clicks you received on your site and from which search queries.

Compare the date range for the last 28 days to the previous period and you will quickly identify which queries are generating direct clicks.
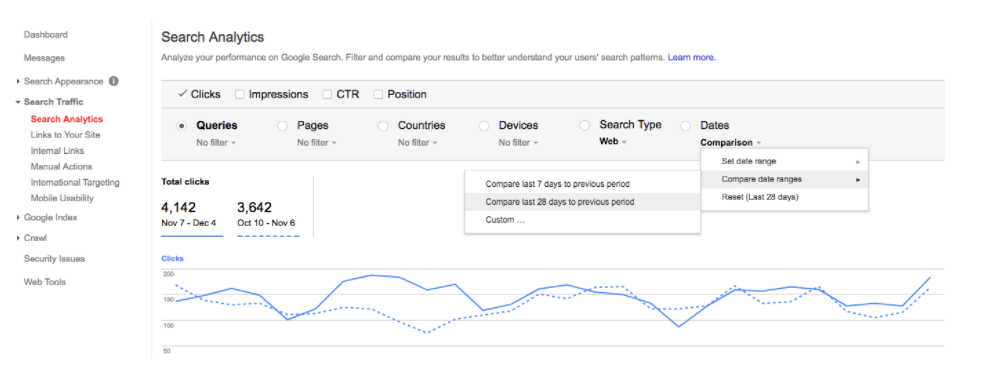
You can also identify the landing pages that are generating the maximum clicks along with the devices that are sending the organic traffic.
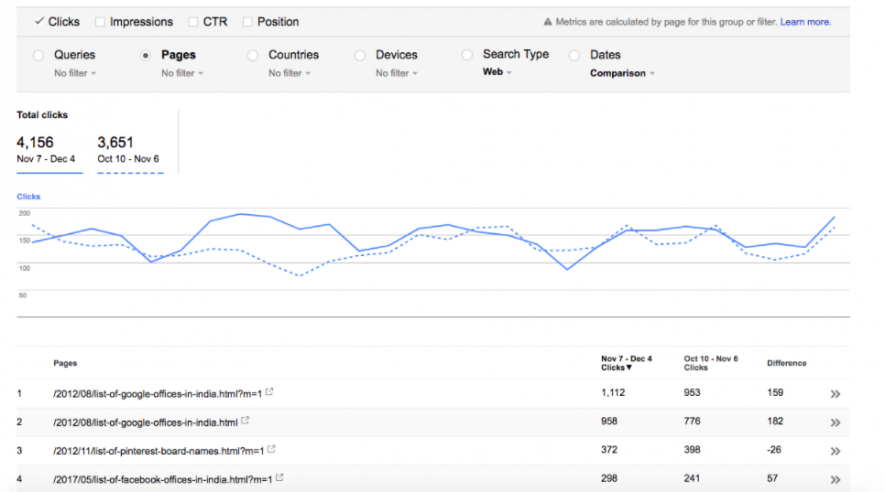
Tip: Ensure to filter the data by search type -> web else you might see a lot of queries based on image search results.
Number of Goal Completions Via Organic Traffic
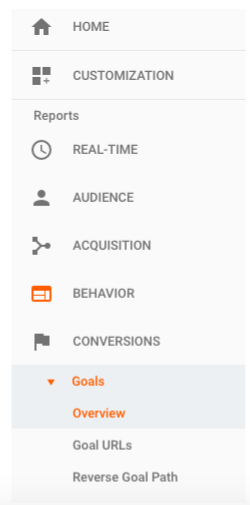
No campaign is ever successful if goals aren’t completed. Visit Goals -> Overview section under the Conversions tab in Google Analytics.
Now, click on “add segment” and select “organic traffic” from the available list.
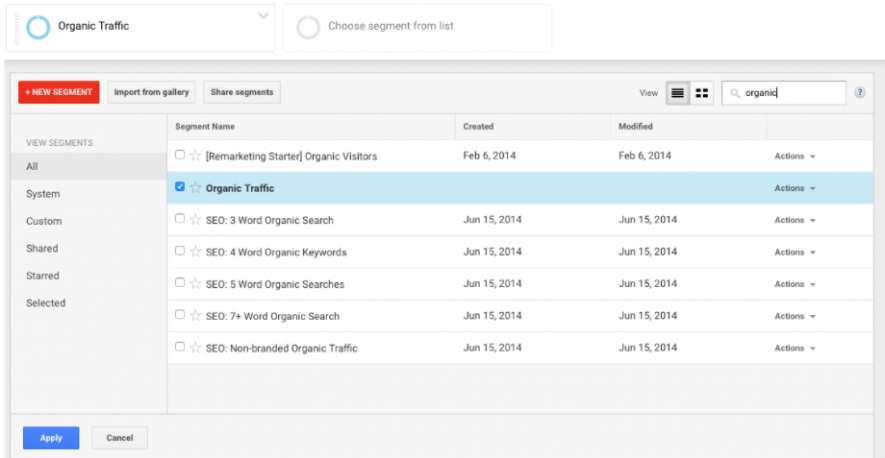
Click apply, and you will see a report like the one displayed in the below screenshot:
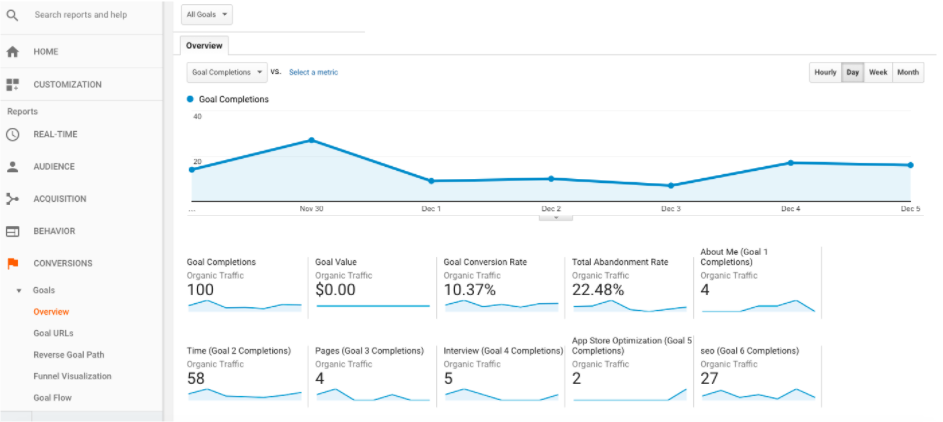
From the report, you can quickly identify important SEO metrics like the number of goal completions, goal value, and goal conversion rate. As we have already filtered the inorganic traffic so the value and metrics you will see here will give you a clear idea about the ROI received via organic traffic
Bounce Rate of Top Landing Pages
There is no point applying strategies to gain rankings if people are bouncing off from the pages that are already receiving the maximum organic traffic.
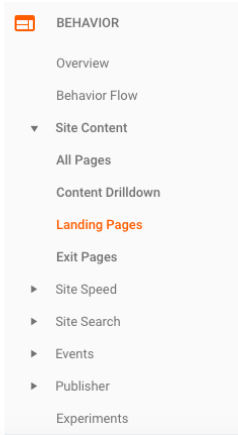
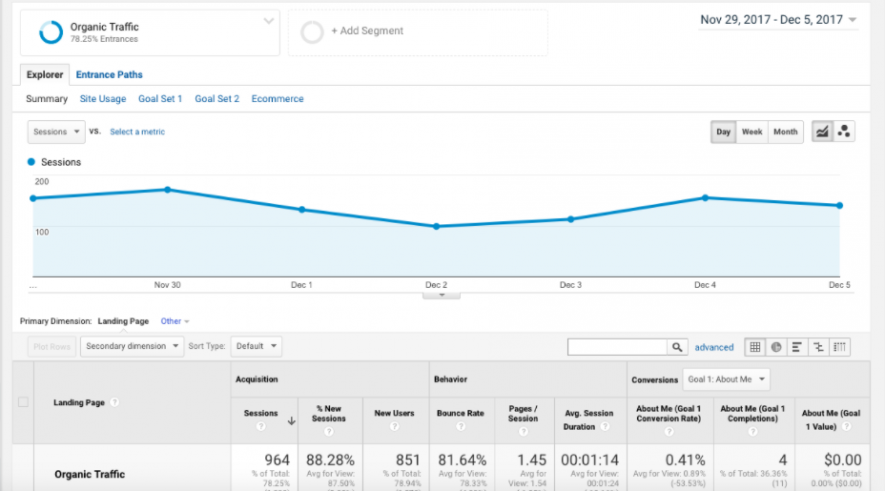
Visit: Behavior -> Site Content – > Landing Pages
You will see the below report that will help you to uncover one of the most important SEO metric of all time, the bounce rate. (Ensure that you already have the Organic traffic segment applied as we did while viewing the goal completions report).
Top Exit Pages
As an SEO professional, it is essential to have an idea on the top landing pages from where the audience are exiting the site.
Keeping the organic traffic segmentation ON, visit:
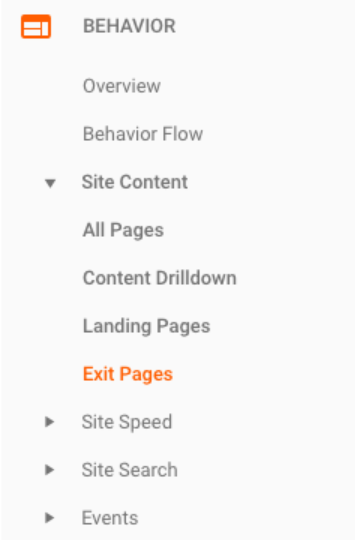
Behavior -> Site Content -> Exit Pages.
Here, you will see the top exit pages of your target website.
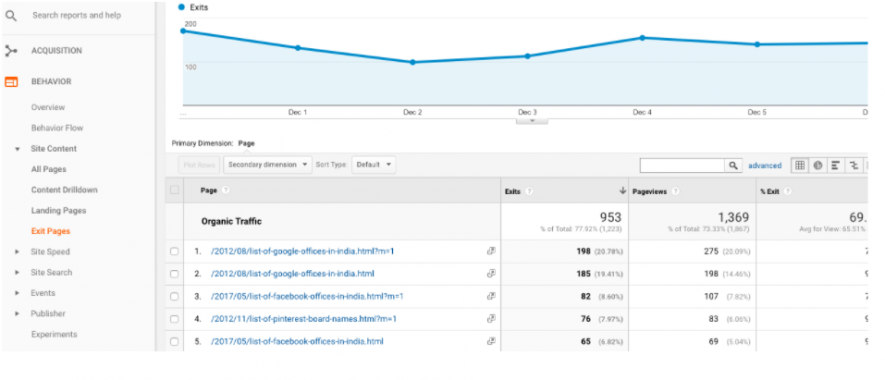
Once you have the data, it will become easier for you to fix the elements that are forcing the visitors to leave the site.
Target Keywords and Their Organic Ranking
This is perhaps the most common metric that every SEO uses. Continue to use the Organic keyword ranking in Google and identify the most prominent keywords that are sending the maximum traffic to the website.
SEMrush position tracking is a great way to monitor positions for any keyword. The data is daily updated so you can see the progress over time. Moreover, a side by side comparison of your keywords rankings vs. your competitors keyword rankings is possible providing you a clearer idea of the success regarding your SEO efforts.

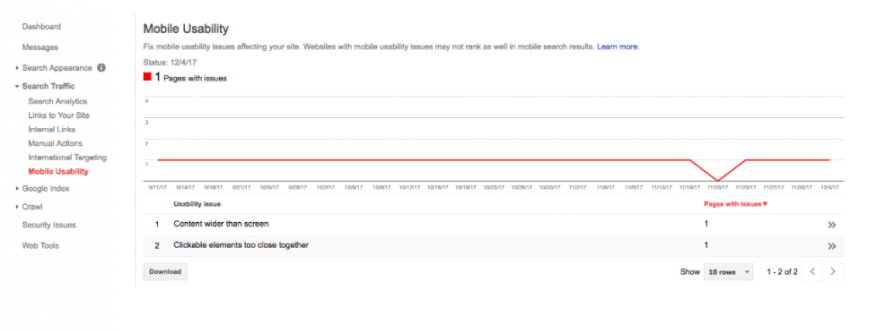
Mobile Usability Report Under Search Console
Mobile traffic has already surpassed desktop traffic, so it is extremely crucial to keep an eye on the mobile usability of your website and make sure the users do not face any problems while browsing your website.
Visit Search Traffic -> Mobile Usability under Search Console to see the report.

The report will clearly show the issue faced by people along with the URLs that are having display issues on the mobile screen. Fix the issues as this will help to improve the user experience of your website.
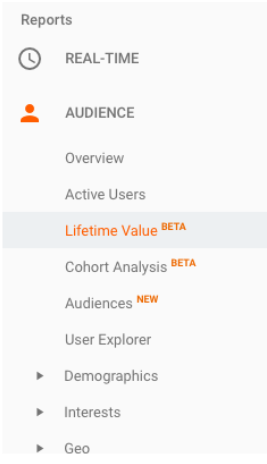
Lifetime Value For Users
The Lifetime Value report under Google Analytics lets you understand the actual value of a particular user for your business based on lifetime performance.
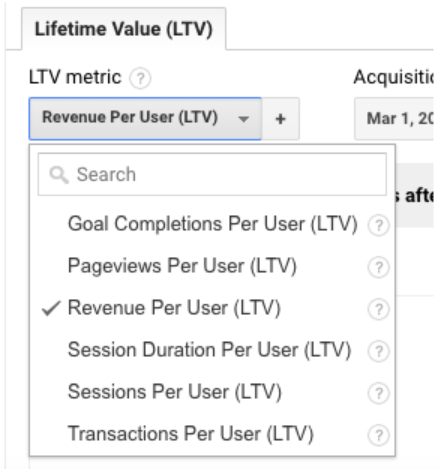
In order to see the Lifetime Value data, click on Audience -> Lifetime Value as shown in the below screenshot:
Under this section, you will see 3 columns namely – acquisition channel, users, revenue per user (LTV) and revenue (LTV).
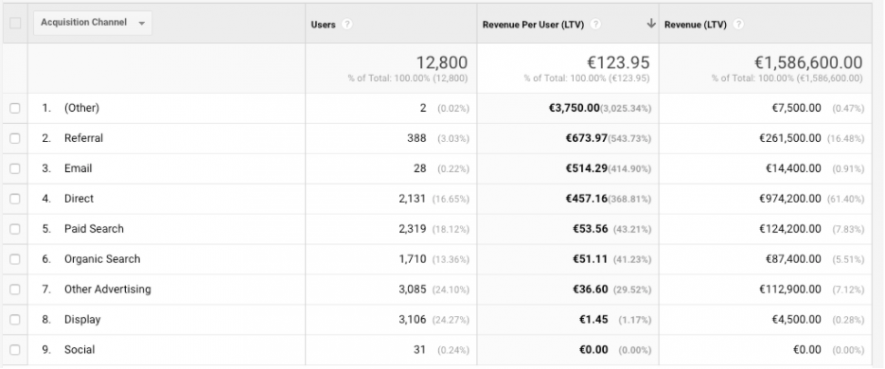
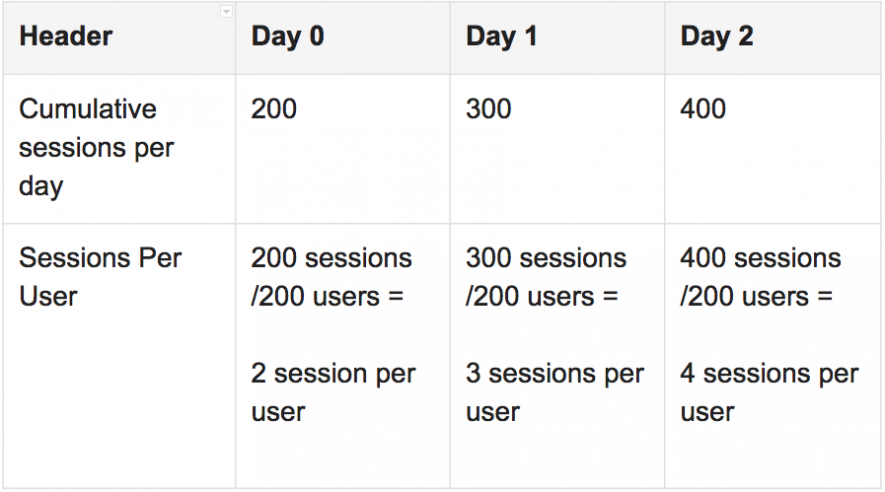
This report presents the data as the cumulative average value per user per the time increment you are using (day, week, month). The main metric, Lifetime value is calculated using the cumulative sum of the metric value divided by the total number of users acquired during the acquisition date range. For example, if you acquired 200 users during the acquisition date range, then Sessions Per User is calculated as follows:
The following metrics can be seen in the report:
- Appviews Per User (LTV)
- Goal Completions Per User (LTV)
- Pageviews Per User (LTV)
- Revenue Per User (LTV)
- Session Duration Per User (LTV)
- Sessions Per User (LTV)
- Transactions Per User (LTV)
This report presents an accurate view of the actual revenue potential of every customer that is gained using organic search.
Crawl Errors Under Search Console
Many webmasters ignore this metric, but it is one of the most crucial metrics to track. The crawl error report will help to uncover the URLs that are inaccessible by Googlebot.
Visit, Crawl -> Crawl Errors under the search console.

You will see a report like the one displayed in the below screenshot:
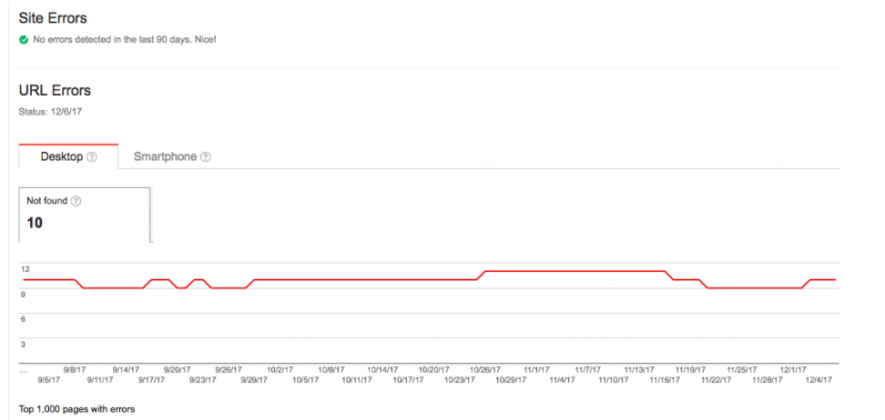
Carefully monitor this report on a regular basis and fix the errors from time to time. Keeping this report error free means that Google is able to properly cache the pages of your websites, thereby increasing the chances of getting more of your webpages ranked in Google and raising the organic search traffic.
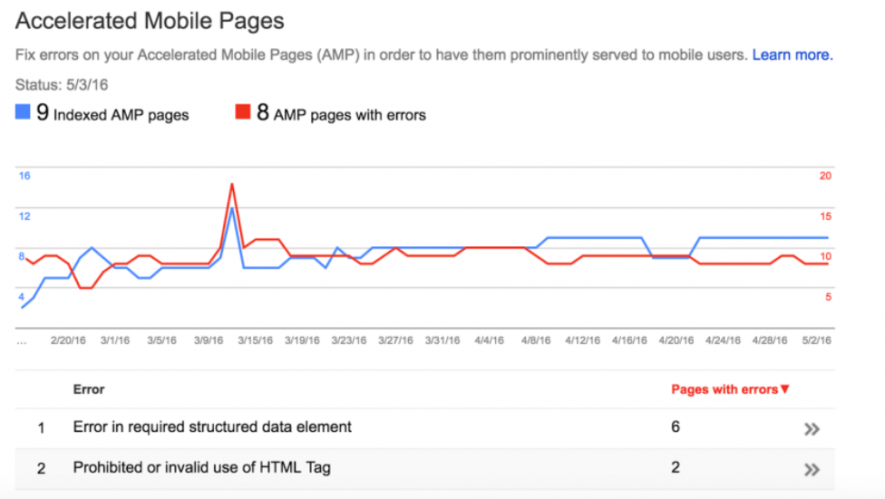
Accelerated Mobile Pages Section Under Search Console
If you still haven’t added AMP pages on your website, then it is time to do so as this is one of the most important metrics to track in 2018.
Visit Search Appearance -> Accelerated Mobile Pages
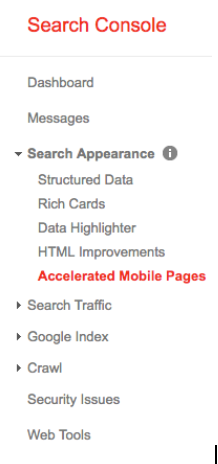
This section will display the list of AMP URLs that are having issues. Regularly monitor and address the critical errors on your AMP pages.
Quality Inbound Link Count and SEMrush Trust Score
Links still form a major part of every SEO strategy as it remains one of the most important ranking factors for Google. Thankfully, SEMrush provides accurate scores to judge the reputation of a domain.
Measure the inbound link count by checking the backlink overview report located under Domain Analytics in SEMrush.

Look at the number of backlinks created over a period of time and check the Trust score.
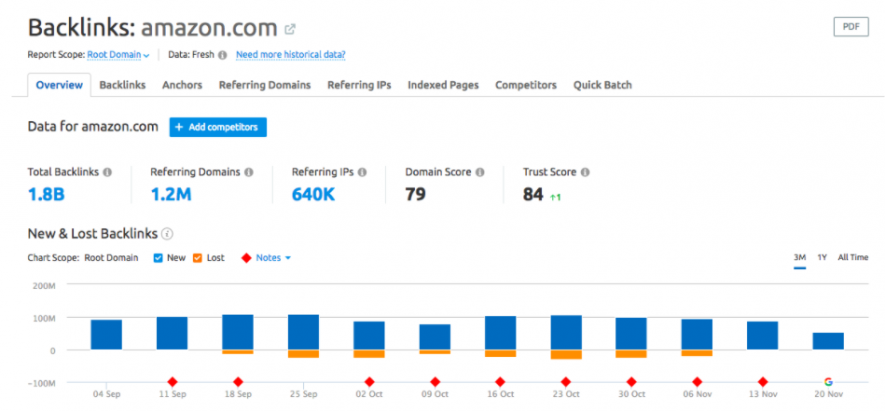
The Trust Score is the measure of the trustworthiness of the domain using a 100 point scale with 0 being the lowest and 100 the highest.
SEO reporting in 2018 is going to face several challenges with clients getting educated than before. Fancy SEO metrics like pageviews don’t work anymore. Start preparing fruitful SEO reports using the metrics shared above and constantly try to improve your current SEO strategy.
Leave a Reply
Want to join the discussion?Feel free to contribute!